దస్త్రం:CO2 emission pie chart.svg

అసలు దస్త్రం (SVG ఫైలు, నామమాత్రంగా 540 × 540 పిక్సెళ్ళు, ఫైలు పరిమాణం: 76 KB)
This is a file from the Wikimedia Commons. Information from its description page there is shown below. Commons is a freely licensed media file repository. You can help. |
సారాంశం
| వివరణ |
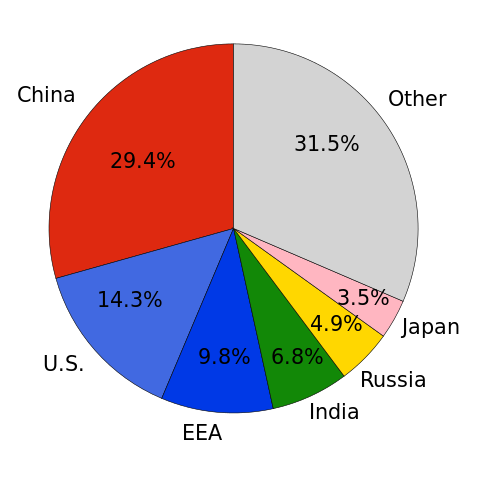
Català: Emissions globals de gasos CO2 l'any 2015 per país.
English: Global CO2 gas emissions in the year 2015 by country. |
|||
| తేదీ | ||||
| మూలం | స్వంత కృతి | |||
| కర్త | Árni Dagur | |||
| అనుమతి (ఈ దస్త్రాన్ని పునర్వినియోగించుకోవడం) |
|
|||
| ఇతర కూర్పులు |
File:CO2 emission pie chart.svg has 3 translations.
Other related versions:[]
|
|||
| SVG పెరుగుదల | This plot was created with Matplotlib. | |||
| Source code | Python code#Very slight changes were made in a text editor.
import matplotlib.pyplot as plt
print('Styles:', plt.style.available)
plt.rcdefaults()
plt.style.use('ggplot')
plt.rcParams['font.size'] = 19
plt.rcParams['patch.edgecolor'] = 'black'
plt.rcParams['lines.linewidth'] = 1
plt.figure(figsize=[6,6])
labels = ['China', 'USA', 'EEA', 'India', 'Russia', 'Japan', 'Other']
sizes = [29.3641757, 14.27217116, 9.814753272, 6.774059821, 4.858885975, 3.457132848, 31.458821414]
colours = ['#de2910', 'royalblue', '#0039e6', '#128807', 'gold', '#ffb6c1', 'lightgrey']
angle = 90
explode = (0, 0, 0, 0, 0, 0, 0)
# ^-- Change this to 0.1 for an explosion effect.
patches, texts, autotexts = plt.pie(sizes, explode=explode, colors=colours, autopct='%1.1f%%', pctdistance=0.815, labels=labels, labeldistance=1.1, shadow=False, startangle=angle)
for at in autotexts:
at.set_fontsize(16.21)
plt.axis('equal')
plt.tight_layout()
plt.gca().set_position([0, 0, 1, 1])
plt.gcf().subplots_adjust(bottom=0.15)
plt.savefig('co2_emission_pie_chart.svg')
|


|
This SVG file contains embedded text that can be translated into your language, using any capable SVG editor, text editor or the SVG Translate tool. For more information see: About translating SVG files. |
This file is translated using SVG <switch> elements. All translations are stored in the same file! Learn more.
For most Wikipedia projects, you can embed the file normally (without a To translate the text into your language, you can use the SVG Translate tool. Alternatively, you can download the file to your computer, add your translations using whatever software you're familiar with, and re-upload it with the same name. You will find help in Graphics Lab if you're not sure how to do this. |
(Data source: Emission Database for Global Atmospheric Research)
Please feel free to change the colours and update this image.
లైసెన్సింగ్
| ఈ దస్త్రం క్రియేటివ్ కామన్స్ CC0 వెయివర్ క్రింద లభ్యం. | |
| ఈ కృతితో సంబంధమున్న వ్యక్తి తనకు ప్రపంచవ్యాప్తంగా కాపీహక్కుల చట్టం క్రింద ఈ కృతిపై ఉన్న అన్ని హక్కులని మరియు ఈ కృతిలో తనకి ఉన్న సంబంధిత న్యాయపరమైన హక్కులని, చట్టం అనుమతించిన మేరకు, వదులుకుని ఈ కృతిని కామన్స్కి అంకితమిచ్చారు. CC0 క్రింద ఉన్న కృతులకు ఆపాందింపు అవసరం లేదు. కృతిని ఉటంకించేప్పుడు, కృతికర్త యొక్క ఆమోదాన్ని మీరు అంతర్నిహితంగా సూచించకూడదు.
|
ఫైలు చరితం
తేదీ/సమయం ను నొక్కి ఆ సమయాన ఫైలు ఎలా ఉండేదో చూడవచ్చు.
| తేదీ/సమయం | నఖచిత్రం | కొలతలు | వాడుకరి | వ్యాఖ్య | |
|---|---|---|---|---|---|
| ప్రస్తుత | 00:11, 31 జనవరి 2024 | | 540 × 540 (76 KB) | Manlleus | File uploaded using svgtranslate tool (https://svgtranslate.toolforge.org/). Added translation for es. |
| 00:02, 31 జనవరి 2024 |  | 540 × 540 (62 KB) | Manlleus | File uploaded using svgtranslate tool (https://svgtranslate.toolforge.org/). Added translation for ca. | |
| 23:59, 30 జనవరి 2024 |  | 540 × 540 (37 KB) | Manlleus | fixed text labels for translation | |
| 04:17, 8 జూన్ 2017 |  | 540 × 540 (54 KB) | Illegitimate Barrister | Centering. | |
| 04:15, 8 జూన్ 2017 |  | 540 × 540 (36 KB) | Illegitimate Barrister | WP:NOTUSA | |
| 01:34, 8 జూన్ 2017 |  | 540 × 540 (30 KB) | ArniDagur | fixed wrong upload | |
| 01:32, 8 జూన్ 2017 |  | 540 × 540 (30 KB) | ArniDagur | lines made black and smaller, font size increased, general improvements | |
| 00:41, 8 జూన్ 2017 |  | 720 × 540 (30 KB) | ArniDagur | made font bigger | |
| 00:18, 8 జూన్ 2017 |  | 720 × 540 (30 KB) | ArniDagur | User created page with UploadWizard |
లింకులు
కింది పేజీలలో ఈ ఫైలుకు లింకులు ఉన్నాయి:
సార్వత్రిక ఫైలు వాడుక
ఈ దస్త్రాన్ని ఈ క్రింది ఇతర వికీలు ఉపయోగిస్తున్నాయి:
- bn.wikipedia.org లో వాడుక
- ca.wikipedia.org లో వాడుక
- ckb.wikipedia.org లో వాడుక
- cy.wikipedia.org లో వాడుక
- da.wikipedia.org లో వాడుక
- en.wikipedia.org లో వాడుక
- es.wikipedia.org లో వాడుక
- fr.wikipedia.org లో వాడుక
- ha.wikipedia.org లో వాడుక
- hu.wikipedia.org లో వాడుక
- hy.wikipedia.org లో వాడుక
- ig.wikipedia.org లో వాడుక
- it.wikipedia.org లో వాడుక
- ka.wikipedia.org లో వాడుక
- ms.wikipedia.org లో వాడుక
- or.wikipedia.org లో వాడుక
- pt.wikipedia.org లో వాడుక
- ro.wikipedia.org లో వాడుక
- ru.wikipedia.org లో వాడుక
- ru.wikinews.org లో వాడుక
- so.wikipedia.org లో వాడుక
- uk.wikipedia.org లో వాడుక
- uz.wikipedia.org లో వాడుక
- vi.wikipedia.org లో వాడుక
- www.wikidata.org లో వాడుక
- zh.wikipedia.org లో వాడుక