దస్త్రం:Cloud computing economics.svg

ఈ ఫైలు SVG కు చెందిన ఈ మునుజూపు PNG పరిమాణం: 483 × 444 పిక్సెళ్ళు. ఇతర రిజల్యూషన్లు: 261 × 240 పిక్సెళ్ళు | 522 × 480 పిక్సెళ్ళు | 836 × 768 పిక్సెళ్ళు | 1,114 × 1,024 పిక్సెళ్ళు | 2,228 × 2,048 పిక్సెళ్ళు.
అసలు దస్త్రం (SVG ఫైలు, నామమాత్రంగా 483 × 444 పిక్సెళ్ళు, ఫైలు పరిమాణం: 7 KB)
This is a file from the Wikimedia Commons. Information from its description page there is shown below. Commons is a freely licensed media file repository. You can help. |
సారాంశం
| వివరణ |
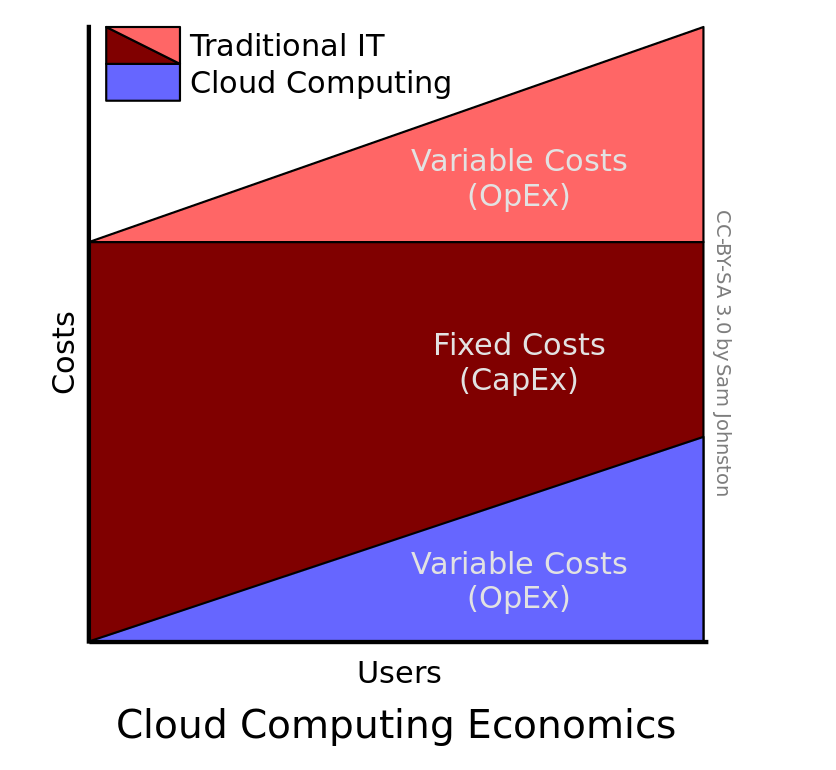
English: Diagram showing economics of cloud computing versus traditional IT, including capital expenditure (CapEx) and operational expenditure (OpEx) |
| తేదీ | |
| మూలం | Created by Sam Johnston using OminGroup's OmniGraffle |
| కర్త | Sam Johnston |
| ఇతర కూర్పులు |
[]
|


Although this diagram is meant to be qualitative, some effort went into the quantitative analysis too. The justification for the splits are a Forrester paper showing that the total cost of cloud computing deployments were 1/3 of that of traditional systems[1] and a CIO magazine article showing that variable costs traditionally account for 30-35% of overall spend[2].
References
లైసెన్సింగ్
నేను, ఈ కృతి యొక్క కాపీహక్కుదారుని, దీన్ని ఈ లైసెన్సు క్రింద ఇందుమూలముగా ప్రచురిస్తున్నాను:
ఈ దస్త్రం క్రియేటివ్ కామన్స్ Attribution-Share Alike 3.0 Unported లైసెన్సు క్రింద లభ్యం.
- ఇలా చేసేందుకు మీకు స్వేచ్ఛ ఉంది:
- పంచుకోడానికి – ఈ కృతిని కాపీ చేసుకోవచ్చు, పంపిణీ చేయవచ్చు, ప్రసారమూ చేయవచ్చు
- రీమిక్స్ చేయడానికి – కృతిని అనుకరించడానికి
- క్రింది షరతులకు లోబడి:
- ఆపాదింపు – సముచితమైన శ్రేయస్సును ఇవ్వాలి, లైసెన్సుకు లింకు ఇవ్వాలి, మార్పులేమైనా చేస్తే వాటిని సూచించాలి. అందుకు సముచితమైన పద్ధతి దేన్నైనా అవలంబించవచ్చు. కానీ మీకూ మీ వాడుకకూ హక్కుదారు అనుమతించారు అనే అర్థం వచ్చేటట్లుగా మాత్రం కాదు.
- share alike – మీరు ఈ కృతిని అనుకరిస్తే, మారిస్తే, లేదా మెరుగుపరిస్తే తత్ఫలిత కృతిని ఇదే లైసెన్సు లేదా దీనికి అనుగుణ్యమైన లైసెన్సు క్రింద మాత్రమే పంపిణీ చేయాలి.
ఫైలు చరితం
తేదీ/సమయం ను నొక్కి ఆ సమయాన ఫైలు ఎలా ఉండేదో చూడవచ్చు.
| తేదీ/సమయం | నఖచిత్రం | కొలతలు | వాడుకరి | వ్యాఖ్య | |
|---|---|---|---|---|---|
| ప్రస్తుత | 02:14, 6 మార్చి 2009 | | 483 × 444 (7 KB) | SamJohnston | {{Information |Description={{en|1=Diagram showing economics of cloud computing versus traditional IT, including capital expenditure (CapEx) and operational expenditure (OpEx)}} |Source=Created by Sam Johnston using OminGroup's [[Wi |
లింకులు
ఈ ఫైలును వాడుతున్న పేజీలు లేవు.
సార్వత్రిక ఫైలు వాడుక
ఈ దస్త్రాన్ని ఈ క్రింది ఇతర వికీలు ఉపయోగిస్తున్నాయి:
- ca.wikipedia.org లో వాడుక
- en.wikipedia.org లో వాడుక
- fr.wikipedia.org లో వాడుక
- hi.wikipedia.org లో వాడుక
- hu.wikipedia.org లో వాడుక