దస్త్రం:Greenland ice sheet temperatures interpreted with 18O isotope from 6 ice cores.png
ఈ మునుజూపు పరిమాణం: 800 × 600 పిక్సెళ్ళు. ఇతర రిజల్యూషన్లు: 320 × 240 పిక్సెళ్ళు | 640 × 480 పిక్సెళ్ళు | 1,024 × 768 పిక్సెళ్ళు | 1,280 × 960 పిక్సెళ్ళు | 1,500 × 1,125 పిక్సెళ్ళు.
అసలు దస్త్రం (1,500 × 1,125 పిక్సెళ్ళు, ఫైలు పరిమాణం: 79 KB, MIME రకం: image/png)
This is a file from the Wikimedia Commons. Information from its description page there is shown below. Commons is a freely licensed media file repository. You can help. |
సారాంశం
| వివరణ |
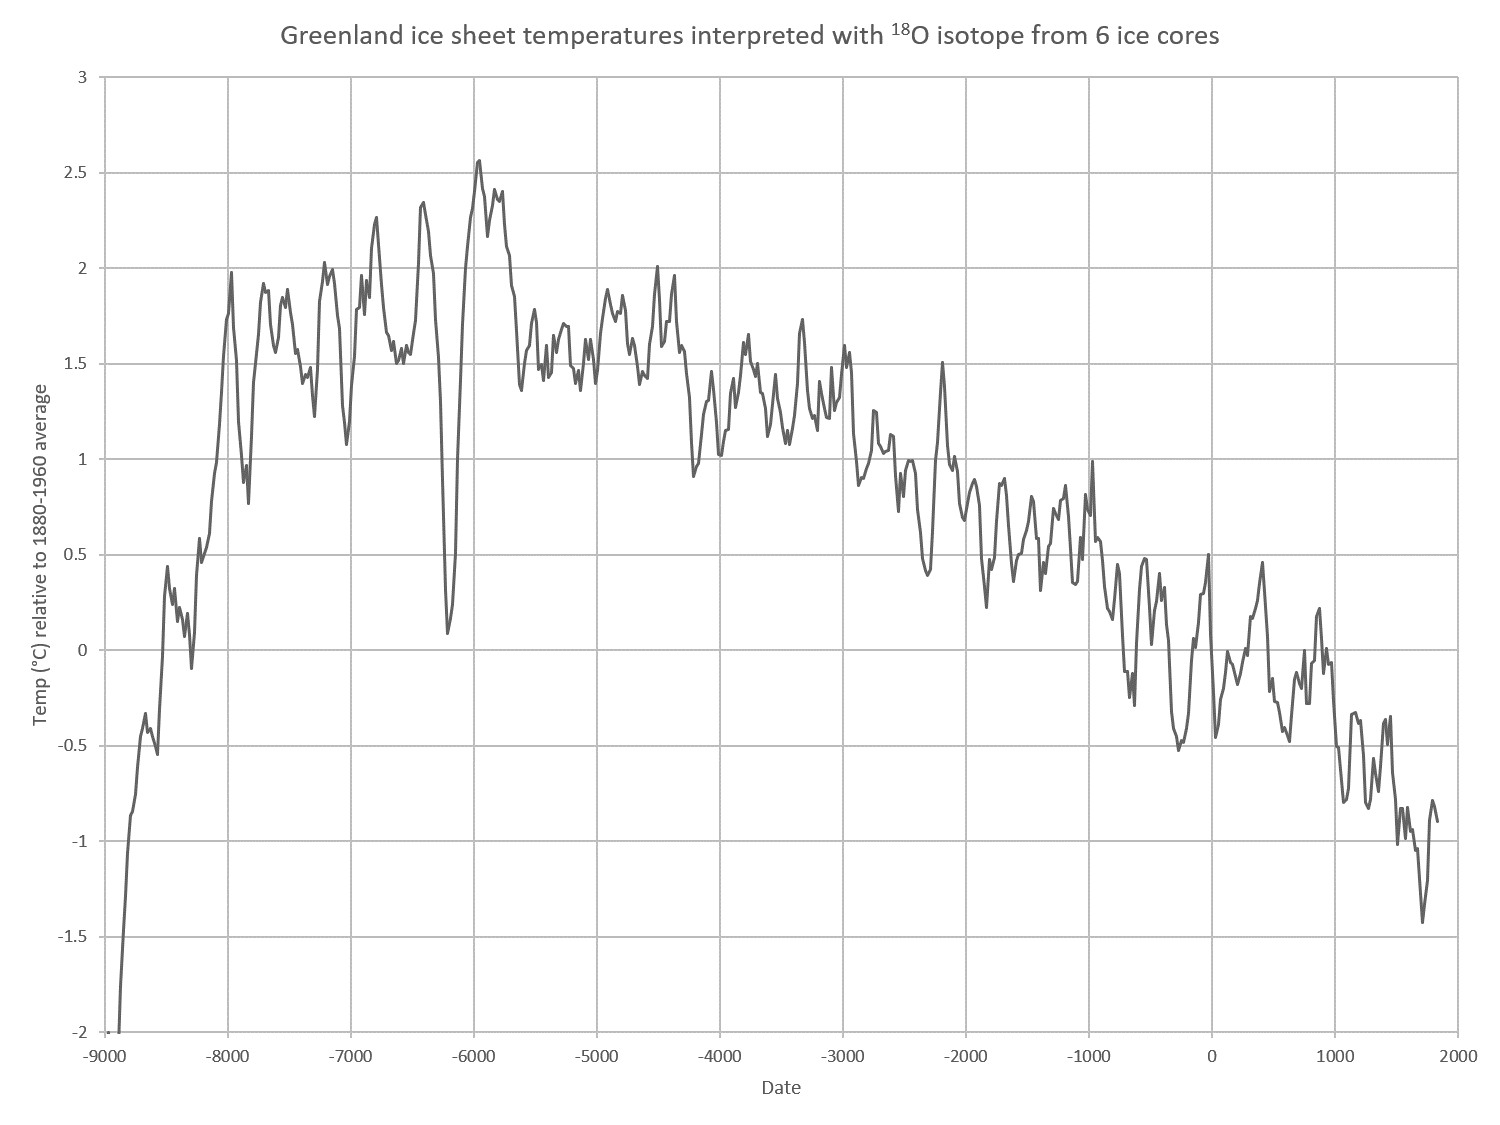
English: The temperature reconstruction produced using data from all six ice cores is shown in the source below, and spans the period from 9690 BC to AD 1970. The attached figure does not include the end record. It has a resolution of around 20 years, meaning that each data point represents the average temperature of the surrounding 20 years. The end of the record – 1970 – showing the average temperature between 1960 and 1980 - is not displayed on this figure (see the source below).
B. M. Vinther, S. L. Buchardt, H. B. Clausen, D. Dahl-Jensen, S. J. Johnsen, D. A. Fisher, R. M. Koerner, D. Raynaud, V. Lipenkov, K. K. Andersen, T. Blunier, S. O. Rasmussen, J. P. Steffensen & A. M. Svensson, "Holocene thinning of the Greenland ice sheet", Nature volume 461, pages 385–388 (17 September 2009). See also: https://www.carbonbrief.org/factcheck-what-greenland-ice-cores-say-about-past-and-present-climate-change |
| తేదీ | |
| మూలం | స్వంత కృతి |
| కర్త | Artreve |
లైసెన్సింగ్
నేను, ఈ కృతి యొక్క కాపీహక్కుదారుని, దీన్ని ఈ లైసెన్సు క్రింద ఇందుమూలముగా ప్రచురిస్తున్నాను:
This file is licensed under the Creative Commons Attribution-Share Alike 4.0 International license.
- ఇలా చేసేందుకు మీకు స్వేచ్ఛ ఉంది:
- పంచుకోడానికి – ఈ కృతిని కాపీ చేసుకోవచ్చు, పంపిణీ చేయవచ్చు, ప్రసారమూ చేయవచ్చు
- రీమిక్స్ చేయడానికి – కృతిని అనుకరించడానికి
- క్రింది షరతులకు లోబడి:
- ఆపాదింపు – సముచితమైన శ్రేయస్సును ఇవ్వాలి, లైసెన్సుకు లింకు ఇవ్వాలి, మార్పులేమైనా చేస్తే వాటిని సూచించాలి. అందుకు సముచితమైన పద్ధతి దేన్నైనా అవలంబించవచ్చు. కానీ మీకూ మీ వాడుకకూ హక్కుదారు అనుమతించారు అనే అర్థం వచ్చేటట్లుగా మాత్రం కాదు.
- share alike – మీరు ఈ కృతిని అనుకరిస్తే, మారిస్తే, లేదా మెరుగుపరిస్తే తత్ఫలిత కృతిని ఇదే లైసెన్సు లేదా దీనికి అనుగుణ్యమైన లైసెన్సు క్రింద మాత్రమే పంపిణీ చేయాలి.
ఫైలు చరితం
తేదీ/సమయం ను నొక్కి ఆ సమయాన ఫైలు ఎలా ఉండేదో చూడవచ్చు.
| తేదీ/సమయం | నఖచిత్రం | కొలతలు | వాడుకరి | వ్యాఖ్య | |
|---|---|---|---|---|---|
| ప్రస్తుత | 10:32, 1 ఏప్రిల్ 2019 | | 1,500 × 1,125 (79 KB) | Artreve | User created page with UploadWizard |
లింకులు
కింది పేజీలలో ఈ ఫైలుకు లింకులు ఉన్నాయి:
సార్వత్రిక ఫైలు వాడుక
ఈ దస్త్రాన్ని ఈ క్రింది ఇతర వికీలు ఉపయోగిస్తున్నాయి:
- fi.wikipedia.org లో వాడుక
- ru.wikipedia.org లో వాడుక
- www.wikidata.org లో వాడుక