దస్త్రం:Radiation Dose Chart by Xkcd.png
అసలు దస్త్రం (1,134 × 1,333 పిక్సెళ్ళు, ఫైలు పరిమాణం: 90 KB, MIME రకం: image/png)
This is a file from the Wikimedia Commons. Information from its description page there is shown below. Commons is a freely licensed media file repository. You can help. |
సారాంశం
| వివరణ |
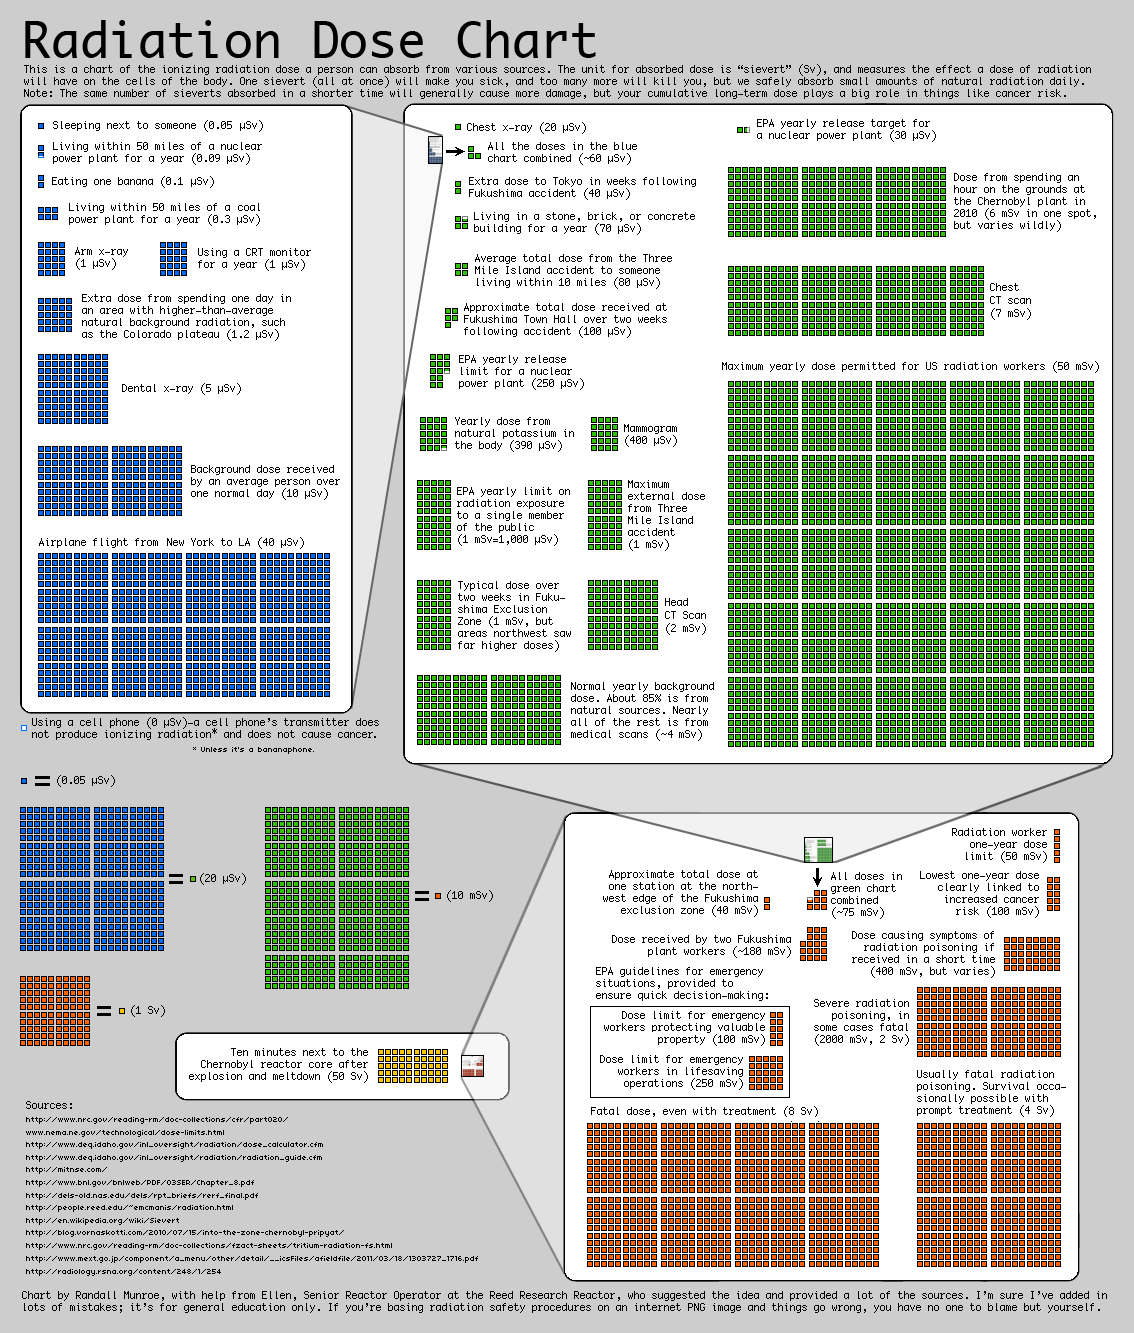
English: Radiation Dose Chart by Randall Munroe as part of the webcomic xkcd.
In response to concerns about the radioactivity released by the en:Fukushima Daiichi nuclear disaster:Fukushima Daiichi nuclear disaster in 2011, and to remedy what he described as "confusing" reporting on radiation levels in the media, Munroe created a chart of comparative radiation exposure levels. The chart was rapidly adopted by print and online journalists in several countries, including being linked to by online writers for The Guardian[1] and The New York Times.[2] As a result of requests for permission to reprint the chart and to translate it into Japanese, Munroe placed it in the public domain, but requested that his non-expert status should be clearly stated in any reprinting.[3]
Français : Graphique des doses radioactives par xkcd |
|||||||||||||||||||||||
| తేదీ | ||||||||||||||||||||||||
| మూలం |
English: Source of the data, according to xkcd website: Français : Source des informations, selon le site de xkcd:
|
|||||||||||||||||||||||
| కర్త |
|
|||||||||||||||||||||||
| అనుమతి (ఈ దస్త్రాన్ని పునర్వినియోగించుకోవడం) |
From original page:
|
|||||||||||||||||||||||
| ఇతర కూర్పులు |
|
|||||||||||||||||||||||


.png)
.svg)

|
File:Exposure chart-XKCD.svg is a vector version of this file. It should be used in place of this PNG file when not inferior.
File:Radiation Dose Chart by Xkcd.png → File:Exposure chart-XKCD.svg
For more information, see Help:SVG. |
 |
లైసెన్సింగ్
| ఈ దస్త్రం క్రియేటివ్ కామన్స్ CC0 వెయివర్ క్రింద లభ్యం. | |
| ఈ కృతితో సంబంధమున్న వ్యక్తి తనకు ప్రపంచవ్యాప్తంగా కాపీహక్కుల చట్టం క్రింద ఈ కృతిపై ఉన్న అన్ని హక్కులని మరియు ఈ కృతిలో తనకి ఉన్న సంబంధిత న్యాయపరమైన హక్కులని, చట్టం అనుమతించిన మేరకు, వదులుకుని ఈ కృతిని కామన్స్కి అంకితమిచ్చారు. CC0 క్రింద ఉన్న కృతులకు ఆపాందింపు అవసరం లేదు. కృతిని ఉటంకించేప్పుడు, కృతికర్త యొక్క ఆమోదాన్ని మీరు అంతర్నిహితంగా సూచించకూడదు.
|
This file, which was originally posted to
http://xkcd.com/radiation/, was reviewed on 24 March 2019 by reviewer Chiyako92, who confirmed that it was available there under the stated license on that date.
|
ఫైలు చరితం
తేదీ/సమయం ను నొక్కి ఆ సమయాన ఫైలు ఎలా ఉండేదో చూడవచ్చు.
| తేదీ/సమయం | నఖచిత్రం | కొలతలు | వాడుకరి | వ్యాఖ్య | |
|---|---|---|---|---|---|
| ప్రస్తుత | 13:12, 15 డిసెంబరు 2016 | | 1,134 × 1,333 (90 KB) | Jerryzhu2004 | Reverted to version as of 17:31, 7 March 2013 (UTC) |
| 12:06, 17 ఏప్రిల్ 2015 |  | 1,134 × 1,333 (87 KB) | RokerHRO | optipng -o7 -i0 → 12.99% decrease | |
| 17:24, 15 మే 2014 |  | 1,134 × 1,333 (100 KB) | Dougsim | Incorrect statement removed: sievert is not the unit of absorbed dose. It is the unit defined by the ICRP/ICRP, applied to many dose quantities of which effective dose is the central dose quantity. The chart has had a single amendment to remove the... | |
| 17:31, 7 మార్చి 2013 |  | 1,134 × 1,333 (90 KB) | CaZeRillo | Removed one mistake, "Extra dose to Tokyo in weeks ..." is supposed to be 40 µSv, not mSv, according to block size. | |
| 14:33, 23 మే 2011 |  | 1,134 × 1,333 (90 KB) | Wwoods | ||
| 22:44, 28 మార్చి 2011 |  | 1,134 × 1,333 (88 KB) | Mwarren us | Reverted to version as of 16:13, 23 March 2011. Error in resolution of download appears to be from Google's Chrome browser. | |
| 22:35, 28 మార్చి 2011 |  | 1,134 × 1,333 (88 KB) | Mwarren us | Uploading png at original resolution of 1134x1333. | |
| 16:13, 23 మార్చి 2011 |  | 1,134 × 1,333 (88 KB) | Esby | {{Information |Description= {{mld |en=Radiation Dose Chart by Xkcd |fr=Graphique des doses radioactive par Xkcd }} |Source= http://xkcd.com/radiation/ |Date= 2011-03-23 |Author= Randall Munroe & Ellen |Permission= |other_versions= }} Category:Xkcd |
లింకులు
కింది పేజీలలో ఈ ఫైలుకు లింకులు ఉన్నాయి:
సార్వత్రిక ఫైలు వాడుక
ఈ దస్త్రాన్ని ఈ క్రింది ఇతర వికీలు ఉపయోగిస్తున్నాయి:
- ar.wikipedia.org లో వాడుక
- da.wikipedia.org లో వాడుక
- en.wikipedia.org లో వాడుక
- en.wikivoyage.org లో వాడుక
- es.wikipedia.org లో వాడుక
- es.wikivoyage.org లో వాడుక
- fr.wikipedia.org లో వాడుక
- he.wikipedia.org లో వాడుక
- hi.wikipedia.org లో వాడుక
- it.wikipedia.org లో వాడుక
- pl.wikipedia.org లో వాడుక
- pt.wikipedia.org లో వాడుక
- uk.wikipedia.org లో వాడుక
- www.wikidata.org లో వాడుక
- zh.wikipedia.org లో వాడుక